Highest proportion of quality wheat spec
22nd November 2016
The proportion of nabim Group 1 varieties hitting a typical high quality bread wheat specification is the highest for 13 years, according to the final results of the AHDB Cereals
The proportion of nabim Group 1 varieties hitting a typical high quality bread wheat specification is the highest for 13 years, according to the final results of the AHDB Cereals & Oilseeds Cereal Quality Survey. A substantial 45% of the samples have hit the spec for this harvest.
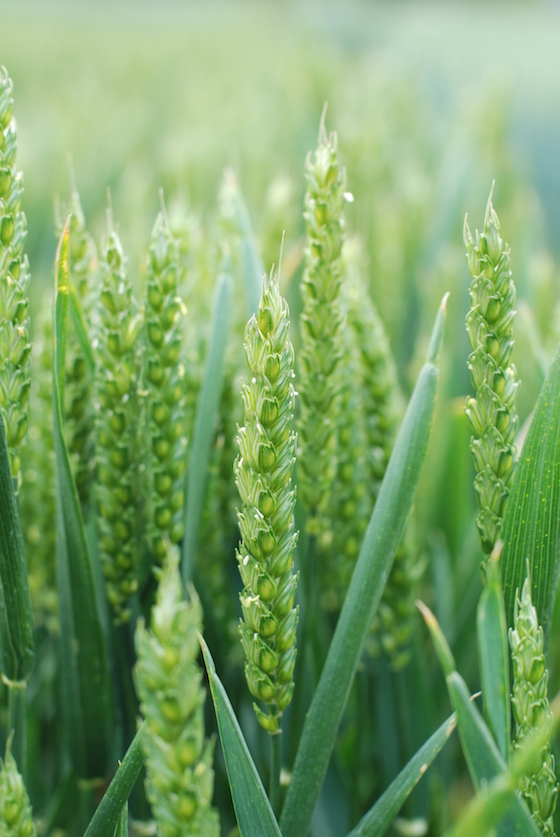
Wheat
With the final results in, there is a much clearer picture of what harvest 2016 looks like for the UK.
For the 17,689 wheat samples analysed in 2016, the results are broadly similar to the second provisional release and provide evidence to the anecdotal comments about smaller grain sizes this year. The average specific weight of wheat in 2016, at 76.7kg/hl, is the lowest result in the past four years.
James Webster, AHDB Cereals & Oilseeds Analyst, commented: “It is worth noting that despite specific weights being lower than the five year average of 77.6kg/hl, the average for Group 1 wheat samples, at 77.4kg/hl is still ahead of the minimum required for high quality bread wheat in the UK (76kg/hl)”.
The average protein content is similar to that seen in the second provisional release, at 12.4%. This represents the highest average protein level in the UK since 2012 and is 0.6% higher than the three year average.
The average Hagberg Falling Number (HFN), has seen a slight fall on the previous results. The final HFN, at 307s, is higher than both last year and the three-year average.
The final results of the 2016 Cereal Quality Survey highlight the high proportion of samples meeting the minimum specifications for high and medium quality bread wheat. The proportion of nabim Group 1 varieties meeting or exceeding the minimum standard for high quality bread wheat (specific weight ≥ 76kg/hl, protein content ≥ 13.0%, HFN ≥ 250s) at 45%, is the highest since 2003.
Furthermore, the proportion of nabim Group 1 & 2 varieties meeting or exceeding the specification for medium quality bread wheat (specific weight ≥ 74kg/hl, protein content ≥ 12.5%, HFN ≥ 180s) this year, is 69%. This compares to 57% last year.
Mr Webster added: “The 2016 results highlight the high proportion of samples meeting milling requirements this year. For instance, the higher protein levels may encourage UK millers to use more domestic wheat. We have already begun to see UK wheat displacing imported wheat in the milling sector. This year the proportion of imported wheat used by the UK milling industry (including bioethanol and starch production) from July to September is the lowest since 2011. As we have previously mentioned, the lower specific weights means extraction rates are likely to be lower, which could also influence the amount of wheat required.”
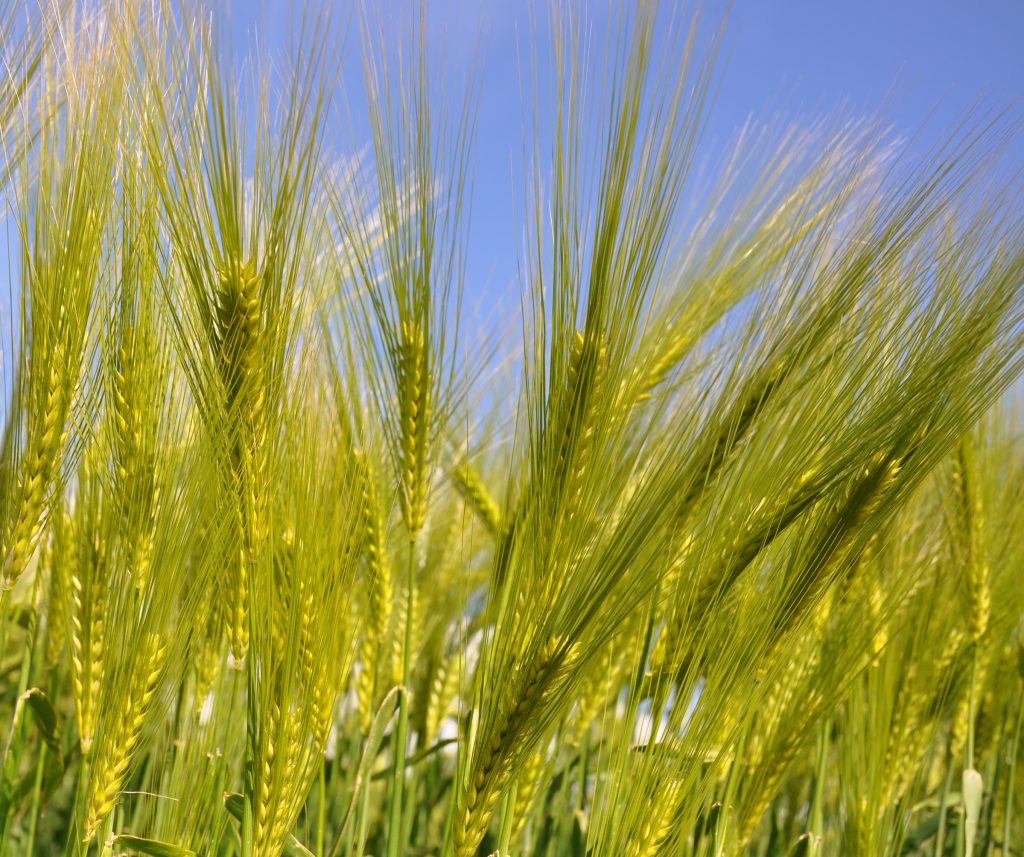
Barley
For the 2016 barley harvest, the AHDB Cereal Quality Survey shows nitrogen levels in line with the three-year average but a smaller grain size than in each of the previous three years.
The percentage of grain retained by a 2.5mm sieve has increased marginally over the course of the survey to 92.1%, with the level passing through a 2.25mm sieve falling slightly to 2.9%. Both the retained and through levels remain worse than the three year average levels of 95.3% and 1.5% respectively. The final results reinforce the earlier indication of smaller than average grain size. As with wheat, the smaller grain size may result in higher volumes of grain being required by the malting industry. There also continues to be a difference in the screening values for spring and winter barley samples, with average retained levels of 89.4% for winter barley and 92.7% for spring barley.
Mr Webster noted: “Barley harvested earlier in the season generally exhibits a lower level of retention and as such, suggests a smaller grain. However, as the season progressed, the retained levels increased, although the national value still remained behind the three year average. This suggests that barley harvested later in the season and further to the North of England and Scotland generally had a relatively larger grain size.”
The average nitrogen level, at 1.57%, is below the three-year average but above the averages for the previous two years. Again, there is an apparent drop in nitrogen levels across the harvest period, falling from an average of 1.61% in the first release to 1.57% at the end of harvest. This is likely due to the increased proportion of samples from Scotland and the North of England, which are predominantly spring barley grown for distilling markets and require lower nitrogen levels. Scotland and the North of England account for 50% of the total barley sample.
Mr Webster commented: “The 2016 Cereal Quality Survey highlights the regional differences in nitrogen content. The average nitrogen content in Scottish barley samples, at 1.49%, is noticeably lower than the average level seen in the East of England at 1.61%. That said, both still remain above last year’s levels.”